Host genetics correlated with the nasal microbiota diversity and composition
We set out by examining the correlation between host genetic variations and the overall diversity of the nasal microbiome in 1401 individuals (63% females; a mean age of 30 years old) with high-depth metagenome data as well as integrated host genome data (a mean depth of 30× for host genome and an average sequencing data of 77.31 ± 23.00 Gb for nasal samples; Supplementary Data 1; Supplementary Fig. 1; Methods). The host genetic principal components (PCs) were examined, and the results revealed strong associations between the top three PCs and microbial α-diversity (p < 0.05 for both Shannon and Simpson indices based on species-level abundances, multivariable linear model; Fig. 1). Specifically, PC1 (r = −0.07, p = 8.7 × 10⁻³), PC2 (r = −0.14, p = 1.39 × 10⁻⁷), and PC3 (r = −0.08, p = 1.8 × 10⁻³) were markedly correlated with the Shannon index. This is consistent with previous analyses of low-depth human genome sequences from 93 individuals in the Human Microbiome Project (HMP), which reported PC1 to associate with α-diversity in the anterior nares13. We verify that the top two host genetic PCs in our cohort are strongly associated with self-reported ancestry, namely the geographical origin of their ancestry (commonly before and including grandfather) from northern or southern China (p < 2.2 × 10⁻¹⁶ for PC1 and p = 1.78 × 10⁻¹¹ for PC2, Wilcoxon rank-sum test; Fig. 1b, c). We further confirmed that the individuals originating from northern China exhibited a higher nasal microbial α-diversity than those who originated from southern China (mean Shannon index of 1.35 vs 1.28; Wilcoxon Rank-Sum test; p = 9.22 × 10⁻³; Supplementary Fig. 2), despite the individuals themselves currently living in the same city. Also, the host genetic PC1 exhibited a correlation with the abundances of 14 nasal genera, including Micrococcus, Anaerococcus, Elizabethkingia, Campylobacter, Finegoldia, Yokenella, Serratia, Streptococcus, Gemella, Staphylococcus, Actinomyces, Malassezia, Veillonella, and Prevotella (Supplementary Data 2; Spearman test; False Discovery Rate (FDR) p < 0.05). Nine of these 14 PC1-associated genera also displayed differential abundances between the individuals deriving from China’s northern and southern regions (Supplementary Data 2; p < 0.05).
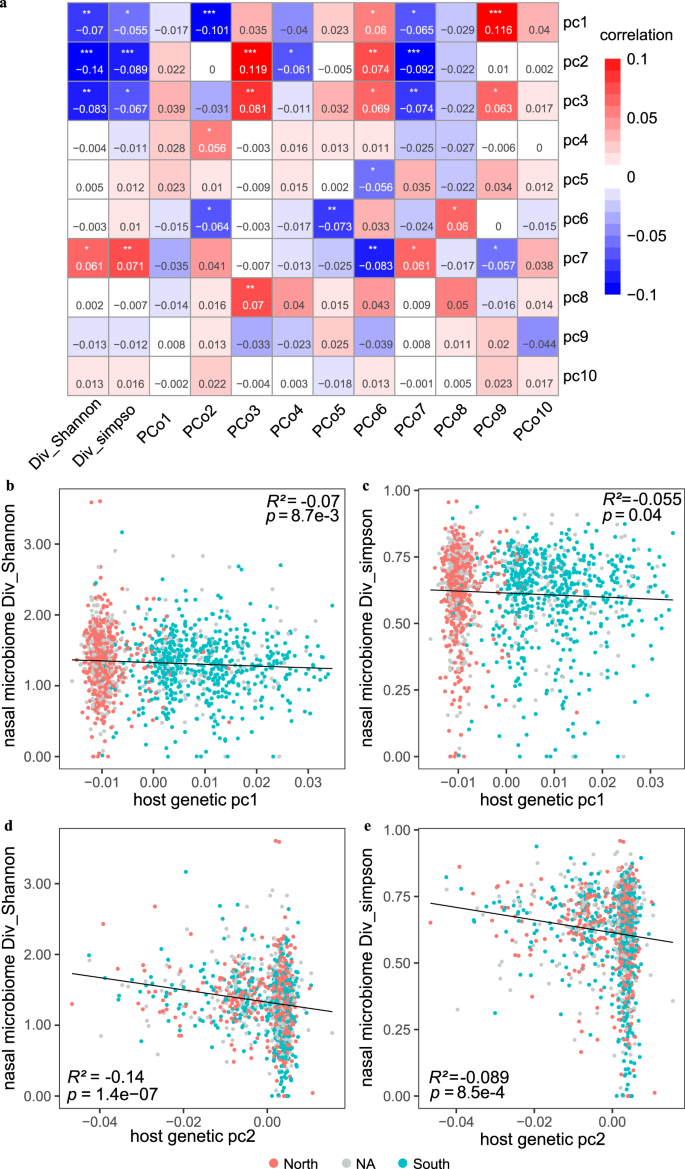
a Correlation (R2) estimates of ten host PCs (PC1-PC10) with the nasal microbial diversity (Shannon and Simpson indices) and compositions (PCo1-PCo10), evaluated using a linear model. Red colours denoted the positive correlation and blue denotes the negative correlation. *p < 0.05, **p < 0.01 and ***p < 0.001. b, c indicate the correlations between the host genetic PC1 and the nasal microbial Shannon index (b) and Simpson index (c), respectively. d, e indicate the correlations between the host genetic PC2 and the nasal microbial Shannon index (d) and Simpson index (e), respectively. The individuals whose ancestry lived in the northern or the southern China were marked in red and blue, respectively. Grey dots represented individuals with the unknown (“NA”) ancestry information.
Furthermore, the top three host genetic PCs showed correlations with four of the top ten microbiome β-diversity principal coordinates (PCos; computed based on species-level Bray–Curtis dissimilarity; p < 0.05 for pairwise associations, Spearman correlation; Fig. 1). Additionally, the top eight host genetic PCs (PC1-PC8) showed at least one correlation with any of the microbiome PCos among PCo2 to PCo8. These results suggested host genetics greatly influence nasal bacterial diversity and composition.
We also investigated associations between host genetic variants and nasal microbiome α-diversity and β-diversity (namely the top ten PCos). This analysis found two loci with marginal genome-wide significance (p < 5 × 10⁻⁸, Fig. 1e, Supplementary Data 3). The SNP rs77221359, located in the intronic region of CACNB2, was significantly associated with the Shannon index representing the α-diversity of nasal samples (p = 2.6 × 10⁻⁸; Supplementary Fig. 3). Notably, CACNB2, which encodes a subunit of a voltage-dependent calcium channel protein that is critical for mediating intracellular Ca2+ influx, has been established as a risk gene for psychiatric disorders such as schizophrenia and bipolar disorder28,29. Additionally, the SNP rs77221359 has been linked to multiple phenotypes or diseases, including chronic heart failure (p = 0.007), asthma (p = 0.012), and chronic sinusitis (p = 0.015), as reported in the biobank Japan (BBJ) database30. The second identified significant association was for SNP rs79409173, located in the intronic region of WNK1, with PCo6 (p = 2.4 × 10⁻⁸; Supplementary Data 3). The serine-threonine kinase WNK1 functioning as a Cl− sensor plays an important role in mature neuron development31,32. These are interesting associations, given the involvement of nasal microbiome in asthma, chronic sinusitis, and neurological diseases33.
Host genetics strongly associated with nasal bacterial or fungal taxa and functions
With this large cohort of both whole genome and whole metagenome data, we next conducted M-GWAS on the nasal microbiome. The microbial taxonomy and function profiles were determined by aligning metagenomic reads to marker genes according to metaphlan3 and humann3, respectively (Supplementary Fig. 3a-b). After filtering highly correlated features, we obtained 293 independent nasal microbial features (Supplementary Data 4; 86 taxa and 207 functions; r2 < 0.995 using a greedy algorithm, Methods). The M-GWAS analyses were performed on 7 million human genetic variants (minor allele frequency (MAF) ≥ 1%) by adjusting for age, gender, body mass index (BMI), sequencing read counts, and the top ten host PCs. Our GWAS analyses did not demonstrate any evidence of an excess false positive rate (genomic inflation factors λGC ranged from 0.979 to 1.054, with a median of 1.012; Supplementary Fig. 4).
In total, we identified 180 independent associations involving 63 independent loci (distance < 1 Mb and r2 < 0.2) and 46 independent taxa/functions reaching genome-wide significance (p < 5 × 10⁻⁸; Fig. 2 and Supplementary Data 5). Out of the 63 loci we identified, 17 were associated with 14 microbial taxa and 47 were associated with 32 bacterial functions. Specifically, seven of the 63 loci were associated with at least two independent taxa or functions (Fig. 2 and Supplementary Data 5). All genome-wide significant associations were listed in Supplementary Data 5. The 63 genome-wide loci explained a higher average fraction of variance (R2) for microbial functions (mean R2 of 8.7%; ranging from 2.49% for PWY-5138: unsaturated, even numbered fatty acid β-oxidation to 19.01% for ANAGLYCOLYSIS-PWY: glycolysis III (from glucose); Supplementary Data 6) compared to microbial taxa (mean R2 of 5.6%; ranging from 2.35% for species Malassezia globosa to 12.48% for class Actinobacteria).
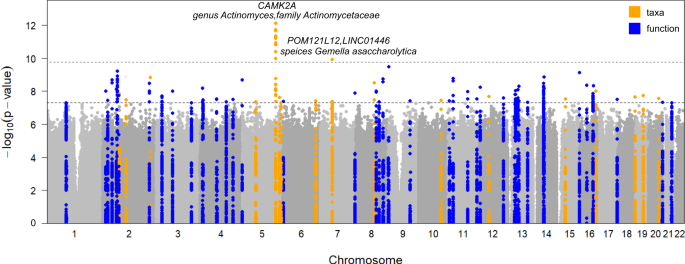
Manhattan plot shows the genetic variants associated with the nasal microbial taxa (n = 86) and functions (n = 207). The horizontal grey and black lines represent the genome-wide (p = 5 × 10⁻⁸) and study-wide (p = 1.71 × 10⁻¹⁰ for 293 independent M-GWAS tests) significance levels, respectively. Seventeen loci associated with taxa and 46 loci associated with functions reaching genome-wide significance were marked in orange and blue, respectively. The top two loci, their located genes, and associated nasal taxa that reached study-wide significance were also listed.
With a more conservative Bonferroni-corrected study-wide significant p-value of 1.71 × 10⁻¹⁰ ( = 5 × 10⁻⁸/293 for 293 M-GWAS tests), we identified 2 genomic loci associated with 3 nasal microbial taxa (Fig. 2).
The strongest association was observed for SNP rs73268759 located in the intronic region of the CAMK2A gene, with minor allele C (MAF = 0.021) positively associated with the presence/absence phenotype of genus Actinomyces (Fig. 3a-b; p = 7.75 × 10⁻¹³) and family Actinomycetaceae (p = 2.06 × 10⁻¹²; spearman r = 0.970 with Actinomyces). When further testing for the association of rs73268759 with the relative abundance of Actinomyces presented in 162 individuals, this association was more significant (Fig. 3c; p = 9.69 × 10⁻¹⁵). The association was also replicated in the gut, with rs73268759 associated with the relative abundances of the gut-derived Actinomyces (Fig. 3d; p = 0.014). CAMK2A encodes a protein belonging to the Calcium/calmodulin-dependent protein kinase II (CAMKII), and its oxidation promotes asthma through the activation of mast cells34. The CAMK2A-associated two taxa, Actinomycetaceae and its main genus Actinomyces, are abundant commensals of the human oropharynx and have been increasingly associated with infections at many body sites35. We found these two taxa were also positively correlated with an increased risk of oral diseases (e.g., oral ulcers and caries), upper respiratory tract infection and urinary system infection (Fig. 3f; multivariable linear regression p < 0.05), when checking the correlation between the two taxa and phenotypic traits in this cohort. Collectively, these results supported a link between the genetic variation in the CAMK2A gene, abundances of the two taxa, and the inflammatory response to the upper respiratory tract.
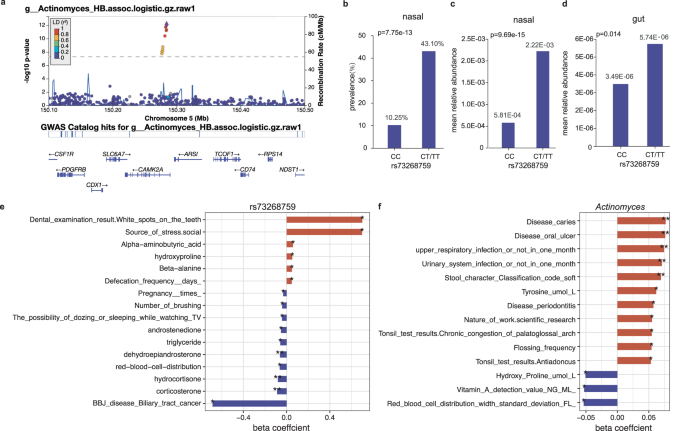
a The regional plot presented the strongest association of CAMK2A variation with the genus Actinomyces (presence/absence status; p = 7.75 × 10⁻¹³). b The prevalences of the genus Actinomyces were compared between different genotyped individuals (CC vs CT/TT) according to CAMK2A (rs73268759) variation. The p-value in b was obtained using a logistic model based on the presence/absence status of the genus Actinomyces. c, d The mean relative abundances of the genus Actinomyces from the nasal (c) and gut (d) sites, compared between different genotyped individuals (CC vs CT/TT) according to CAMK2A (rs73268759) variation. The statistical comparisons in (c) and (d) denote the p-values of the linear regression analysis on log-transformed relative abundances. All analyses were performed by adjusting sex, age, BMI, sequencing reads, and the top ten PCs. e The bar plot showed associations of the CAMK2A (rs73268759) variation with host traits in this cohort. f The correlations of the genus Actinomyces with host traits in this cohort. In e, f, only associations or correlations with p < 0.05 were shown. Significant code: 0.05 * 0.01 ** 0.001. The source data for e-f was available in Supplementary Data 15.
The second strongest association was seen on rs35211877, which is a deletion of allele T (MAF = 0.057) located 163 kb downstream of the POM121L12 gene. This deletion was negatively associated with Gemella asaccharolytica (Fig. 2; p = 1.13 × 10⁻¹⁰). Furthermore, this deletion was also found to be associated with increased risks of asthma (p = 0.005), epilepsy (p = 0.005), and gastroesophageal reflux disease (p = 0.012) when searching the BBJ database. We also found that Gemella asaccharolytica had a positive correlation with stress sources (p = 1.07 × 10⁻⁴), frequently allergic sub-health status (p = 0.003), and gastritis (p = 0.023), but a negative correlation with vitamin D and D2 levels in this cohort (Supplementary Fig. 5).
Cutibacterium was the most abundant genus in the nose (Supplementary Fig. 6), and it was linked to the SNP rs186899741 located in the intergenic region of OCSTAMP and SLC13A3 (p = 2.62 × 10⁻⁸). This SNP was associated with 25-hydroxyvitamin-D3 (p = 0.001) in this cohort and type 2 diabetes (p = 0.006) in the BBJ. The second most abundant genus Corynebacterium (Supplementary Fig. 6) was linked to the SNP rs117538984 located in the intronic region of BARD1 (p = 1.44 × 10⁻⁹), which was associated with colorectal cancer (p = 0.002) and pulmonary tuberculosis (p = 0.01) in the BBJ. Interestingly, BARD1 is also known to interact with BRCA136, and has been reported to be elevated in the urine of breast cancer patients compared to controls37. In addition, we found several associations involving bacteria commonly detected in other body sites, for example, rs139288082 in UST with Streptococcus oralis (an oral commensal, belongs to the mitis group of streptococci and occasionally causes opportunistic infections such as bacteremia and endocarditis38), rs2716569 in the intergenic region of LINC01568 – LOC101928035 with Malassezia globosa (a traditionally known fungus for the skin microbiome, implicated in conditions such as inflammatory bowel diseases39, lung infections, and breast cancer40).
In addition to the associations with nasal microbial taxa, 46 host genetic loci were linked to nasal functions. For example, ANAGLYCOLYSIS-PWY: glycolysis III (from glucose) was linked to three gene loci, including PUM3, NELL1, and LINC02580. Both PUM341 and NELL142 exhibited the ability to regulate cell proliferation. COLANSYN-PWY: colonic acid building blocks biosynthesis was linked to multiple SNPs in the MEIS1 gene (p = 5.70 × 10⁻¹⁰; associated with monocyte count43). PWY-5686: UMP biosynthesis was linked to LMF1 (p = 7.36 × 10⁻¹⁰), which harbours variants associated with extreme respiratory outcomes following preterm birth44. Compared with the taxa associations, the interpretation of associated functional pathways as a single factor pointing to a specific biological mechanism is challenging due to their complexity. These associations and their underlying interaction mechanisms called for further verification and investigation in future studies.
PheWAS and gene expression analysis for 63 microbiome-associated loci
To better understand the potential biological mechanism of the 63 nasal microbiome-associated variants (MAVs), we first explore their associations with diseases and traits. The phenome-wide association study (PheWAS) conducted on this cohort and the BBJ revealed that these 63 MAVs were enriched in 24 host-related traits and diseases: five diseases (asthma, type 2 diabetes(T2D), colorectal cancer, atopic dermatitis, abortion), glucose and low-density lipoprotein (LDL) from the BBJ cohort; six metabolic-related traits including chromium, phenylalanine, triglyceride, vitamin A, lymphocytes count and diastolic pressure; as well as health conditions (sleep quality, sub-health status) and lifestyles in this cohort (fisher exact test p < 0.05; Fig. 4).
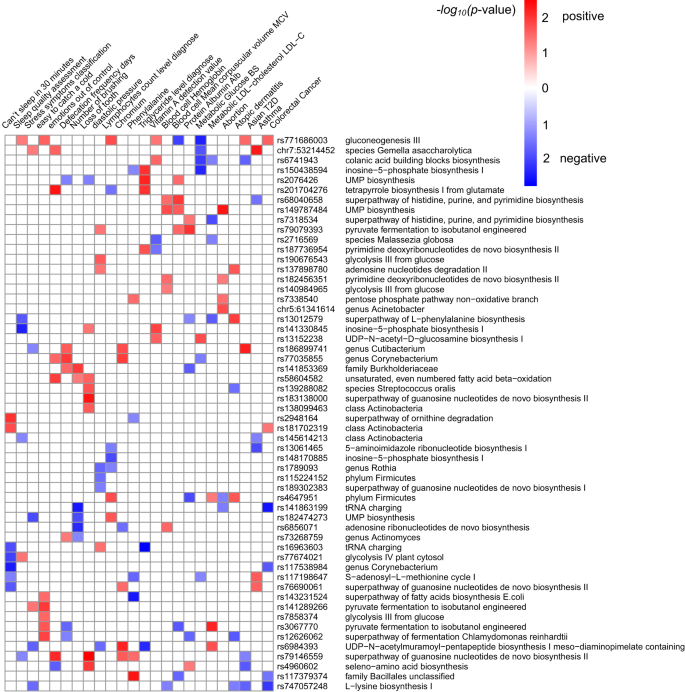
The heatmap plot showed associations of index SNPs of the top 63 loci with traits in this cohort or diseases in the BBJ cohort. 56 of the top 63 SNPs showed enrichments and were listed, and only traits or diseases with significantly enriched p < 0.05 are shown. The enriched p-value was calculated using the fisher exacted test. The red indicted the positive association and the blue indicted the negative association between SNP and corresponding trait.
As the 63 MAVs are mostly located in the intronic or intergenic region, we annotated their associations with gene expression in a recently published nasal airway epithelium transcriptome data45 and across the 49 tissues in the Genotype-Tissue Expression (GTEx) database46. 26 of the 63 MAVs were mapped to 33 genes (intronic or <5 KB upstream/downstream). We investigated the expressions of the 33 top genes across 50 tissues and found that over half (>16) of the genes significantly demonstrated expression in seven of the 50 tissues (Fig. 5a). As expected, the nasal airway epithelium exhibited the strongest enrichment, with 23 of the 33 genes showing significantly expressed (p < 10−4; Supplementary Data 7). The tissues such as thyroid, muscle skeletal, lung, testis, nerve tibial, and oesophagus muscularis, which are also enriched tissues shared by the gut MAV eQTL target genes47, also showed enrichment. BARD1 (associated with the abundance of genus Corynebacterium) and LMF1 (associated with the abundance of PWY-5686: UMP biosynthesis) were the top two most expressed genes because of cumulative representation across 50 tissues (Supplementary Fig. 7). The strongest M-GWAS signal gene CAMK2A is enriched in 17 tissues. The hierarchical clustering showed several MAV top genes (ALMS1, ESD, ARHGAP10, MBP) were more significantly expressed in the nasal airway epithelium than the other tissues (Fig. 5b).
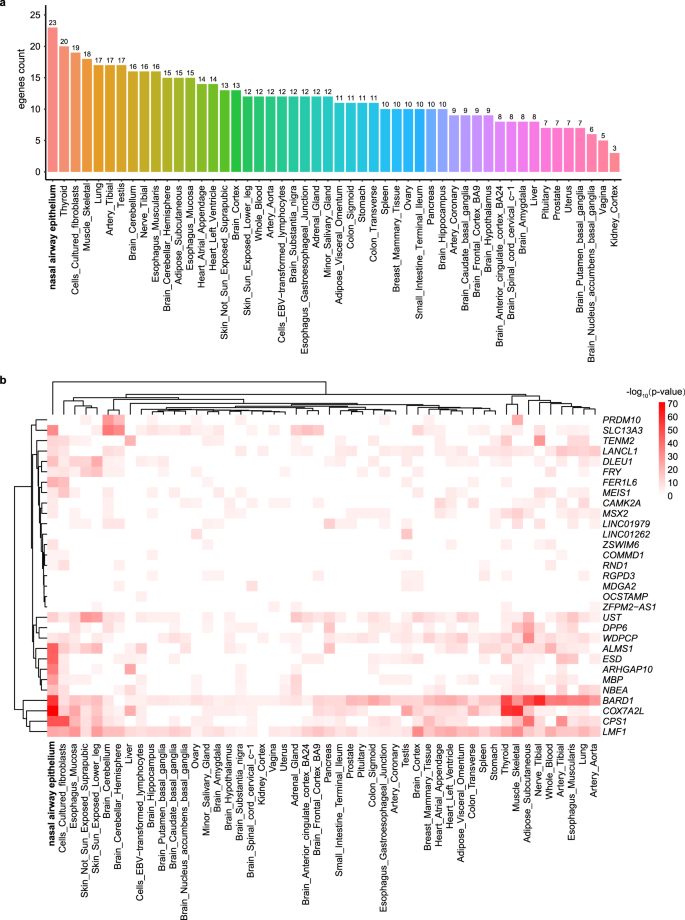
a. The barplot showed the enrichment of 33 MAV genes (intronic or <5KB upstream/downstream) across the 50 tissue groups. b. The heatmap displayed the gene expression values of 33 MAV genes across the 50 tissue groups. The expression values come from a nasal airway epithelium transcriptome dataset and the GTEx v8 datasets. Cells filled in red represent higher expression compared to cells filled in white across genes and tissues.
We further expanded the genetic associations with suggestive p < 10−6 (Supplementary Data 8) and performed gene expression analysis in the tissues, followed by gene functional mapping and disease enrichment analysis with the FUMA48 platform (Methods). Those nasal MAVs of suggestive significance were mapped to 413 genes (<5 Kb for associated genetic loci). These genes exhibited enrichment for differentially expressed in multiple tissues including the most significant enrichment in the nasal airway epithelium and thyroid (Supplementary Fig. 8), in agreement with the findings using the genome-wide significant MAVs.
Gene functional mapping with FUMA found that the gene sets of suggestive MAVs were mainly enriched in calcium signaling and regulating hippo signaling pathways, by using the KEGG, Wikipathways, and GO databases (Supplementary Fig. 9). The disease-enriched analysis in the GWAS catalogue using FUMA showed that the MAVs were enriched in 75 traits (pbon < 0.01; Supplementary Fig. 10), with the strongest link to cardiometabolic related traits such as obesity-related traits, systolic blood pressure, diastolic blood pressure, body mass index, platelet count. It was also found that MAVs were involved in neuropsychiatric symptoms such as cognitive decline rate in late mild cognitive impairment, general cognitive ability, schizophrenia, dementia and core Alzheimer’s disease neuropathologic changes (Supplementary Fig. 10). Correlations between MAVs with asthma, T2D, and colorectal cancer were confirmed through both the PheWAS analysis of BBJ and the bigger GWAS dataset using FUMA. Links between MAVs and diastolic pressure and sleep phenotypes were also replicated in this study and that of in GWAS catalogue studies using FUMA tool. Interestingly, MAVs showed correlations with smoking phenotypes (smoking status and smoking initiation), which have been reported to be key determinants of the airway microbiome49,50. This result suggests individual genes may influence the nasal microbes by making an individual genetically more likely to smoke or not, which needs to further validate in other cohorts due to the rarity of smokers in this current cohort.
Host genetics and other factors contributed comparably to the nasal microbiome
The above-identified 63 genome-wide significant loci could infer 9.51% of the variance in the nasal microbiome β-diversity. Applying association analysis for host genetic variants and microbiome β-diversity, we identified 21 loci with suggestive significance (p < 10−5; Supplementary Data 9). Among the top index variants, eight were associated with Staphylococcus epidermidis (n = 4) or Corynebacterium accolens (n = 4), which were among the most abundant commensal in the nose (Supplementary Data 4) and might possess antimicrobial activity against pathogens51,52. The 21 top index variants that were most closely associated with β-diversity, while not reaching genome-wide significance, could explain 10.59% of the variance in the community structure, with each of them contributing from 0.34% to 0.70% of the variation (Supplementary Fig. 11). This observed R2 (10.5%) under the real data was significantly greater than the average R2 (7.4%) of 100 permutations (P < 2.2 × 10⁻²⁶, t-test, this p represented the fraction of permutations in which the fraction of inferred variance was greater than observed). This fraction was lower than the proportion of host genetics influencing the gut microbiome (~20%) but close to that of the oral microbiome (10.14% ~ 14.14%), as previously inferred in the same cohort19,20. This is expected as the nasal cavity is more open compared to the half-closed oral and fully closed gut environments.
After establishing the contribution of host genetics to nasal microbiome composition and functions, we investigated the extent to which environmental factors influence the nasal microbiome compared to genetics. Among the 340 host traits (age, gender, BMI, dietary, lifestyle, health status questions, and blood measurements), 45 were significantly associated with β-diversity (BH-adjusted FDR < 0.05), via PERMANOVA analysis (Supplementary Data 10). The five strongest associated factors observed were sex, serum testosterone and estradiol, serum iron concentration, and muscle mass, each explaining a variance of 0.65% to 1.47%. In total, the 45 significant host factors could infer 10.76% of the variance in the nasal microbiome β-diversity. This analysis showed that the contribution of host genetics to the nasal microbiome may be comparable to the other host factors. Host genetics together with other host factors collectively explained 19.19% of the variance in the nasal microbiome community.
From observational correlation to Mendelian randomization for the nasal microbiome and host traits
Host factors greatly influenced the nasal microbiome composition, we further investigated the correlation of trait-microbiota pairs for the 293 unique nasal microbial features and 340 host traits using multivariate linear regression. After adjustment for gender, age, BMI, depth, and the top four PCs, we observed 402 significant associations (Benjamini–Hochberg (BH)-adjusted P < 0.05, Supplementary Data 11). The genus Elizabethkingia and its species E. miricola, E. bruuniana, as well as genus Serratia and its species S. grimesii, showed the most links to the host traits (n = 40, 34, 33, 27 and 30, respectively, Supplementary Fig. 12). In return, creatine, cystine, aspartic acid, chromium, magnesium, and cystathionine were among the metabolites associated with the largest number of microbial features (n = 42, 33, 22, 20, 20 and 17, respectively, Supplementary Fig. 12).
Since top associated genetics variants showed strong power as instrumental variables (Supplementary Fig. 13) and well explained for both the nasal microbiome and host traits (Supplementary Fig. 14, Methods), as well as the strong correlations between them, we next performed bidirectional one-sample Mendelian randomization analysis for the 402 observationally significant associations, aiming to reveal the potential causal relationships between the nasal microbial features and host traits. In total, we identified 128 suggestive causal effects with p < 0.05, of which 4 were significant after Bonferroni correction (p < 1.24 × 10-4 = 0.05/402; Fig. 6, Supplementary Data 12). The strongest MR evidence lies in Serratia grimesii that was causally associated with an increased cystine level (β = 0.42, p = 1.34 × 10⁻⁵). Cystine is formed from the jointing of two cysteine molecules, and cysteine metabolism genes have been reported to be widely present in the S. grimesii BXF153. Moreover, the growth of Serratia grimesii could be well predicted under a given cysteine environment in simulations that used the gapseq model54 (Supplementary Fig. 15). Compared to Serratia grimesii, Streptococcus oralis that showed no correlation with the cystine level in the observational and MR analysis was not influenced by adding the cystine in the simulation (Supplementary Fig. 15). In addition, Yokenella regensburgei was inferred to causally reduced glutamic acid and creatine concentrations. Further investigation of the genomics functional modules55 confirmed Serratia grimesii was widely involved in cysteine and Yokenella regensburgei was widely involved in glutamic acid (glutamate) metabolic related pathways (Supplementary Fig. 16), supporting the MR inferences. The microbial superpathway of guanosine nucleotides de novo biosynthesis II was negatively associated with the dental condition of loss of tooth.
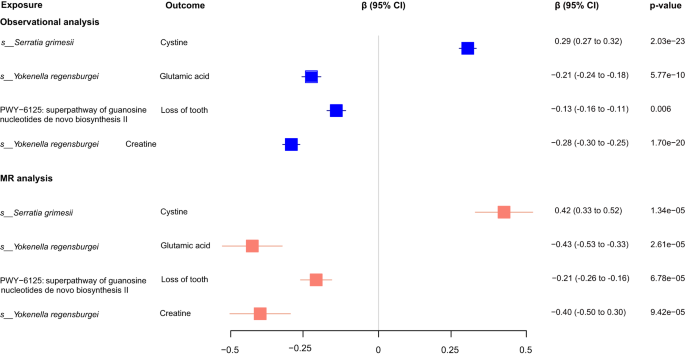
Forest plot (in blue) showed the observational phenotypic correlations between the nasal microbial features and host traits (mainly metabolites), as calculated using the multivariate linear analysis corresponding to Supplementary Data 11. The β coefficient (95% CI) and BH adjusted p-value were shown. Forest plot (in red) represented the causal effects of microbial features on host traits (mainly metabolites), as calculated using the one-sample MR analysis corresponding to Supplementary Data 12. The β coefficient (95% CI) and p-value were shown.


